BackBack
# TSLA 全面深度分析报告 **分析日期:2026年4月15日 | 当前价格:$391.95** --- ## 一、多周期技术分析 ### 📅 周线(Weekly) 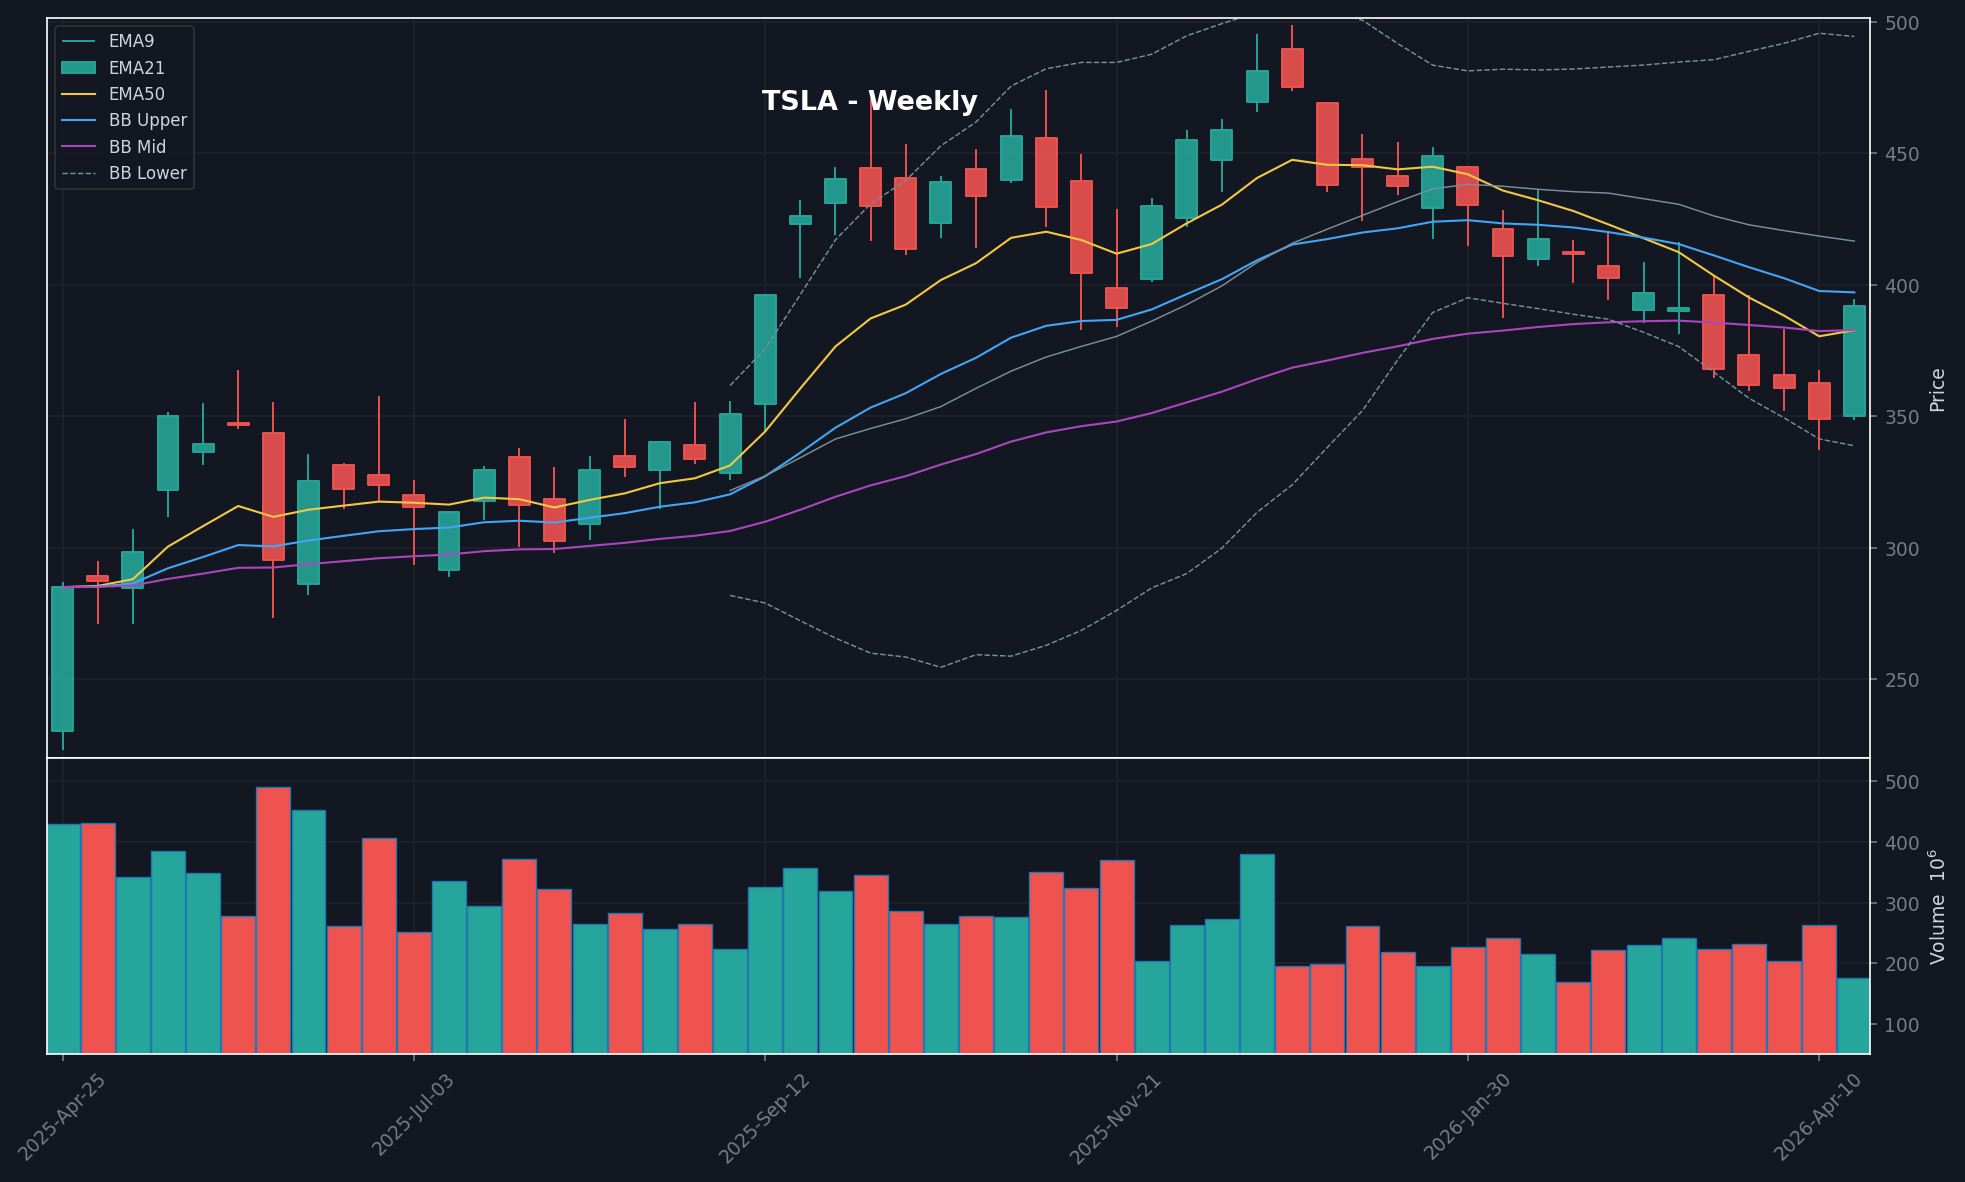 **趋势方向:中性偏弱,短线反弹** | 指标 | 读数 | 信号 | |------|------|------| | EMA排列 | EMA9(382)<EMA21(397)>EMA50(381) | EMA9已收复EMA50,但仍在EMA21下方,空头结构未破 | | RSI | 48.69 | 中性偏弱,未超买也未超卖 | | MACD | -8.7 / 柱-9.0 | 死叉且柱状负值扩大,中期动能偏空 | | 布林带 | 收于(391)中轨(416)下方 | 价格在中下区间,上方空间受压 | | ADX | 18.65 | 趋势强度弱,方向不明确 | | Stoch | K=46
Found this analysis helpful? Share it with your network.